Analytics
Know what plays.Scale what pays.
Every playable you publish comes with its own data in your client panel — so creative decisions are backed by how real players behave.
Client panel · Data
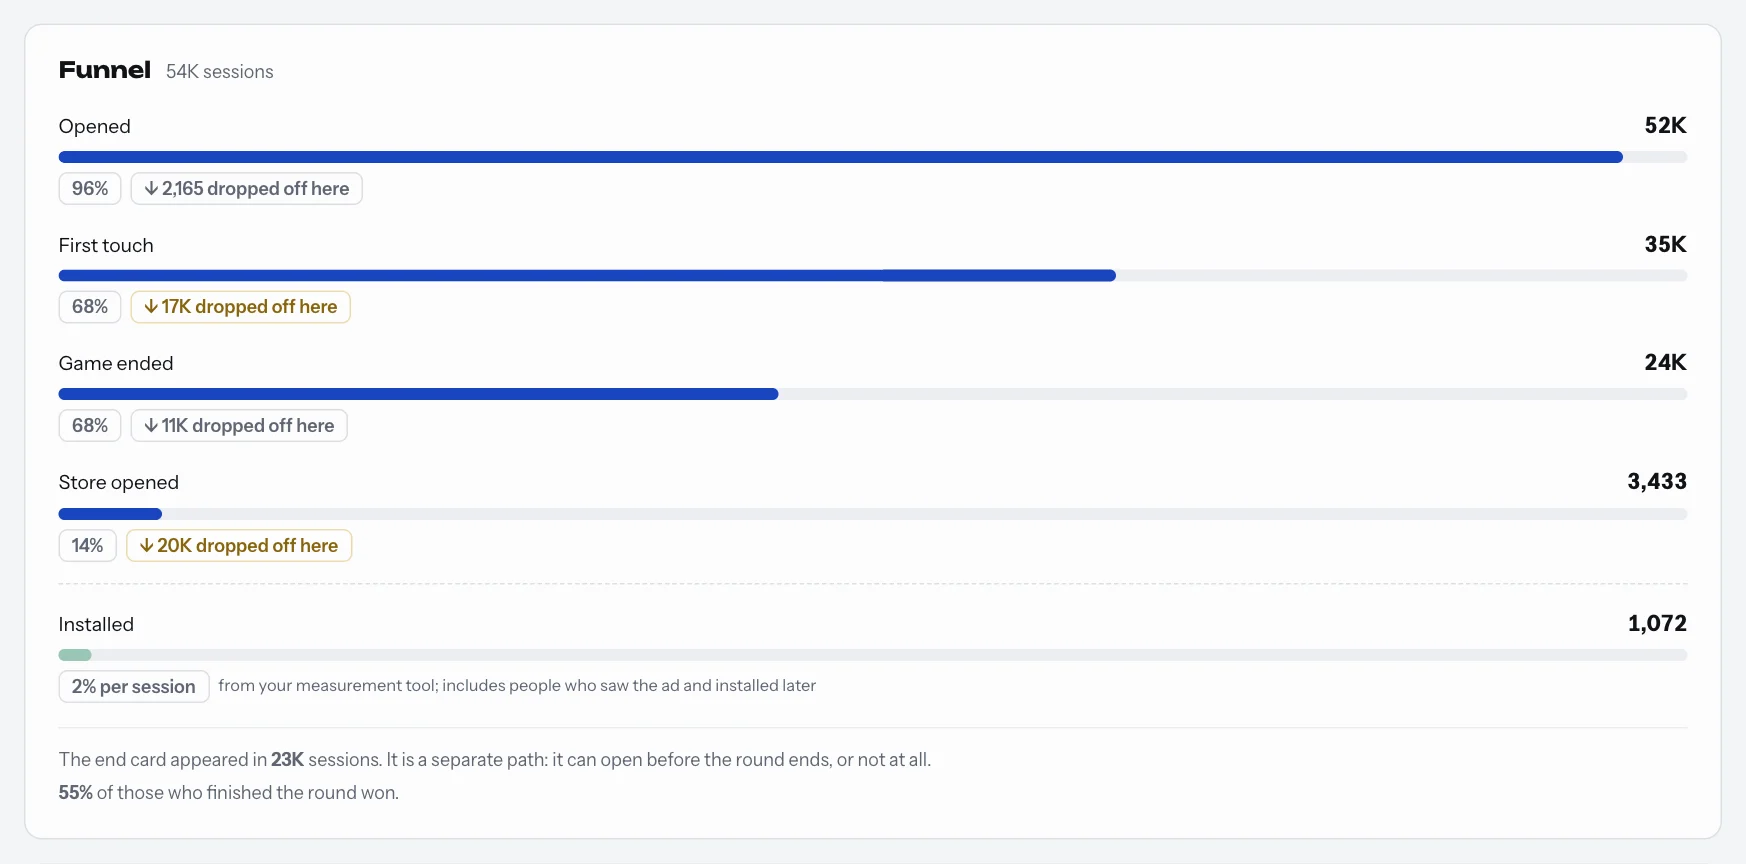
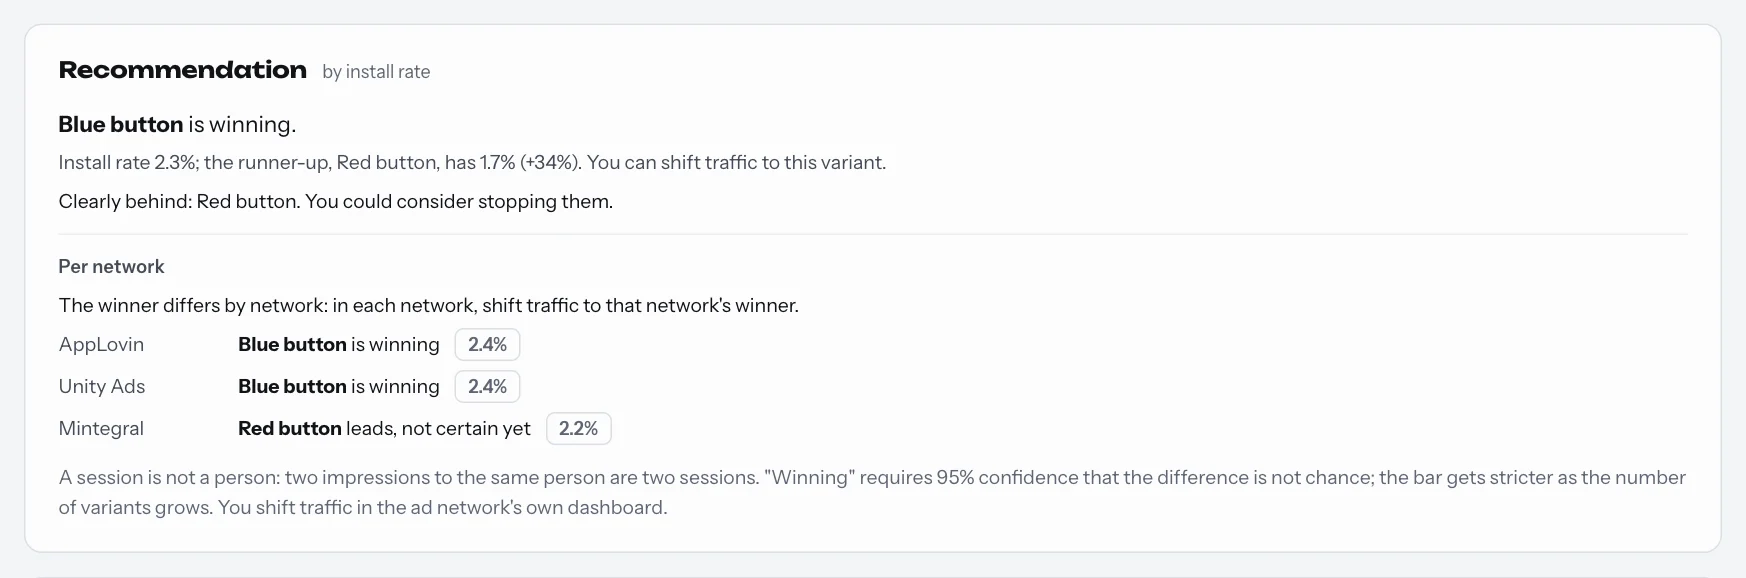
Funnel and recommendation
What you can track
From first tapto install click.
Every playable, one view
Pick a project and a variant to see its funnel, daily chart and per-network breakdown in your client panel.
Engagement you can read
Opens, first touches, finished games, store clicks and installs — the signals that tell you if a playable lands.
Find the drop-off
See where players stop playing so you know exactly which moment to fix next.
Compare versions
Put variants side by side, per network. The panel tells you which one is winning by install rate, and when it’s too early to tell.
We don't just make ads. We make ads playable.